")
")


Click-Through Rate (CTR) is one of the most important metrics in digital marketing. It tells you how many people actually clicked on your ad, email, or link after seeing it.
A high CTR means your content is catching attention. A low CTR means people are scrolling past without engaging.
Businesses often struggle with CTR because it’s not just about getting views. It’s about convincing people to take the next step.
That could mean clicking on a Google Ad, opening an email, or visiting your website. Without a healthy CTR, even the best campaigns can fail to deliver results.
In this guide, we’ll break down what CTR really means, why it’s so important, and what factors can affect it. You’ll also see industry benchmarks, real examples, and practical tips to improve your own CTR.
So, let’s get started!
What is Click-Through Rate (CTR)?
Click-Through Rate, or CTR, is a metric that shows how many people clicked on a link compared to how many saw it.
In simple terms, it tells you how effective your link, ad, or email is at grabbing attention.
CTR is different from other metrics. Impressions count how many times your content was seen. Conversions measure how many people completed an action, like buying a product. CTR focuses only on clicks.
Marketers track CTR because it shows how well their content or ads perform. A higher CTR usually means more interest and engagement, which can lead to more traffic, leads, and sales.
How to Calculate Click Through Rate?
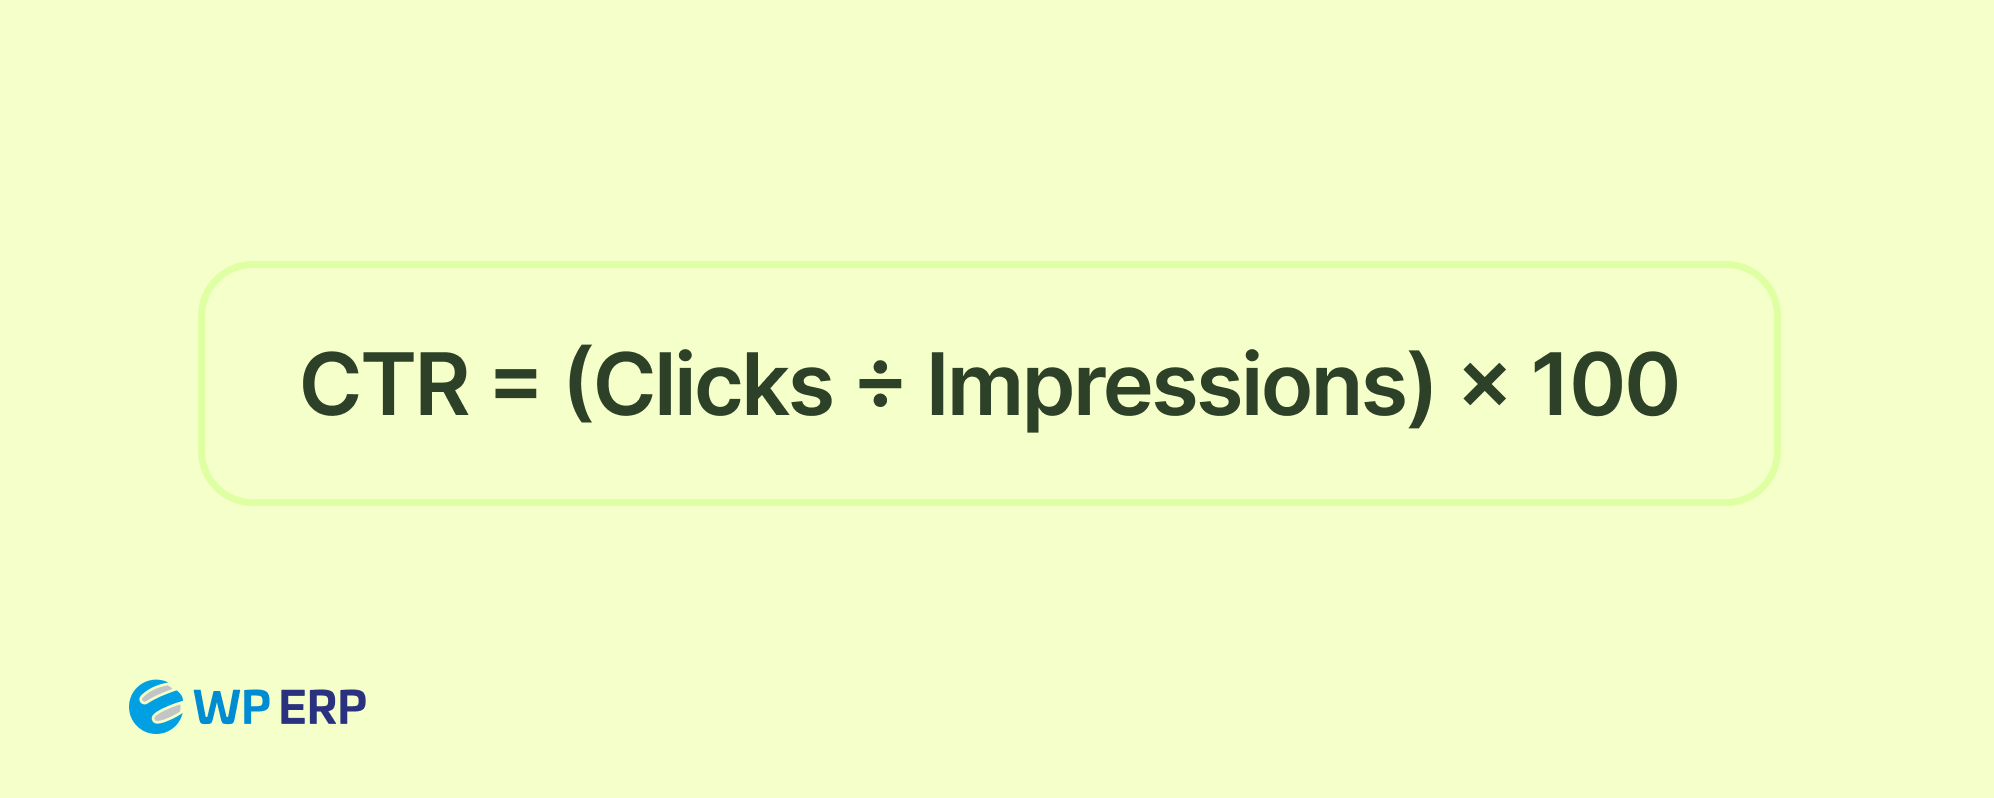
Click-Through Rate (CTR) shows how many people clicked on your link after seeing it. It helps you understand if your content, ad, or email is grabbing attention.
The formula is simple:
CTR = (Clicks ÷ Impressions) × 100
Let’s break it down:
- Clicks: How many people clicked on your link, ad, or button.
- Impressions: How many people saw it.
Example: Imagine 1,000 people see your online ad. Out of them, 50 people click on it.
CTR = (50 ÷ 1,000) × 100 = 5%
This means that 5 out of every 100 people who saw your ad clicked on it.
CTR can be calculated for different places:
- Website links: How many visitors clicked a button or link on your page.
- Emails: How many people clicked a link in your email compared to total emails opened.
- Ads (Google, Facebook, etc.): How many people clicked your ad compared to how many saw it.
Tracking CTR helps you understand what works and what doesn’t. A high CTR usually means your title, ad, or content is interesting and relevant. A low CTR shows you might need to improve your message, design, or targeting.
Impressions vs Click Through Rate vs Conversion Rate – What Are the Differences?
These three metrics are often used together but measure different things. Understanding the difference is key to tracking your online performance.
1. Impressions
- Impressions count how many times your content, ad, or link is seen.
- Example: If 1,000 people see your ad on a website, that’s 1,000 impressions.
- It doesn’t matter if people clicked or not—it only measures visibility.
2. Click-Through Rate (CTR)
- CTR shows the percentage of people who clicked your link or ad after seeing it.
- Formula: CTR = (Clicks ÷ Impressions) × 100
- Example: If 50 people clicked your ad out of 1,000 impressions, CTR = 5%.
- CTR measures how effective your content is at attracting clicks.
3. Conversion Rate
- Conversion rate measures how many people completed a desired action after clicking, like buying a product or signing up for a newsletter.
- Formula: Conversion Rate = (Conversions ÷ Clicks) × 100
- Example: If 50 people clicked your ad and 10 bought the product, Conversion Rate = 20%.
- It shows how effective your page or offer is at turning clicks into results.
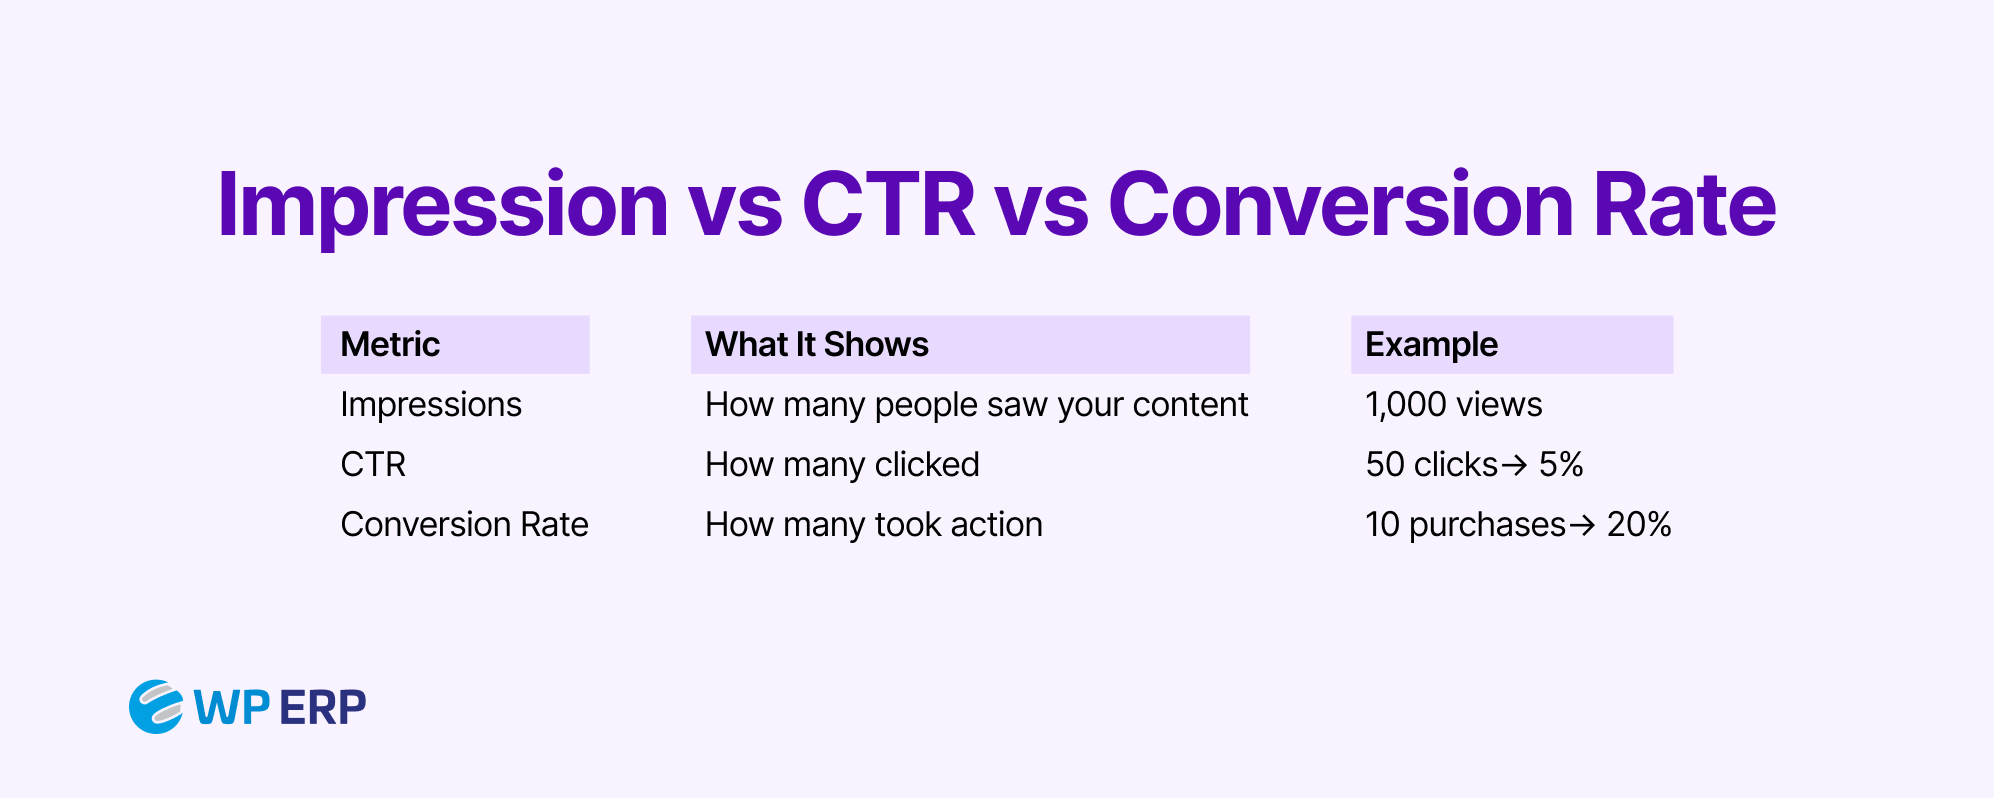
In short:
- Impressions = Visibility
- CTR = Interest / Engagement
- Conversion Rate = Results / Actions
Tracking all three together gives you a full picture of how your campaigns perform, from getting noticed to driving real results.
Here’s a simple comparison table for Impressions vs CTR vs Conversion Rate:
| Metric | What It Measures | Formula | Example | Key Insight |
|---|---|---|---|---|
| Impressions | How many times your content, ad, or link is seen | — | 1,000 people see your ad = 1,000 impressions | Shows visibility but not engagement |
| Click-Through Rate (CTR) | Percentage of people who clicked after seeing your content | CTR = (Clicks ÷ Impressions) × 100 | 50 clicks ÷ 1,000 impressions × 100 = 5% CTR | Shows how effective your content is at attracting clicks |
| Conversion Rate | Percentage of people who completed a desired action after clicking | Conversion Rate = (Conversions ÷ Clicks) × 100 | 10 purchases ÷ 50 clicks × 100 = 20% | Shows how effective your page or offer is at driving results |
Click Through Rate Benchmarks by Industry
Click-Through Rate (CTR) benchmarks are crucial for evaluating the effectiveness of your online campaigns. CTR varies significantly across different industries due to factors like audience intent, competition, and ad relevance.
(i) Website CTR Benchmarks
For websites, average CTR is 1% – 5%, depending on industry and traffic source. CTR can fluctuate based on the industry and the nature of the content.
While specific data for website CTRs is limited, it’s generally observed that industries with high user intent, such as technology and finance, tend to have higher CTRs compared to more passive industries like lifestyle or fashion.
(ii) Email Campaign CTR Benchmarks
Email marketing CTRs also vary by industry. According to a report by Smart Insights, the average CTR for email campaigns across various industries is approximately 3.2%.
However, this can range from 1% to 5% depending on factors like personalization, subject lines, and audience segmentation.
(iii) Google Ads CTR Benchmarks
Google Ads CTR benchmarks are more readily available and provide a clearer picture of industry performance:
a) Google Search Ads: According to WordStream, the average CTR for Google Search Ads is 3.17%. However, this varies by industry. For instance:
- Arts & Entertainment: 13.10%
- Sports & Recreation: 9.19%
- Shopping, Collectibles & Gifts: 8.92%
- Real Estate: 8.55%
- Education & Instruction: 6.17%
- Finance & Insurance: 5.70%
- B2B: 5.17%
- Beauty & Personal Care: 5.92%
- Automotive: 5.65%
- Attorneys & Legal Services: 4.24%
- Arts & Entertainment: 11.43%
b) Display Ads: According to CXL, the average CTR for Google Display Ads is 0.46%. Industries with higher engagement on display ads include:
- Arts & Entertainment: 0.51%
- Sports & Recreation: 0.51%
- eCommerce: 0.51%
- Restaurants & Food: 0.47%
- Real Estate: 1.08%
- Industrial & Commercial: 0.46%
- Home & Home Improvement: 0.49%
- Health & Fitness: 0.59%
- Finance & Insurance: 0.52%
- Education & Instruction: 0.53%
- Career & Employment: 0.59%
- B2B: 0.46%
- Beauty & Personal Care: 0.72%
- Automotive: 0.60%
- Attorneys & Legal Services: 0.59%
- Arts & Entertainment: 0.51%
Why Do Benchmarks Differ Across Industries?
Several factors contribute to the variation in CTR benchmarks across industries:
- Audience Intent: Users actively searching for specific products or services are more likely to click on relevant ads, leading to higher CTRs in industries like legal services or real estate.
- Ad Relevance and Quality: Well-targeted and compelling ads resonate more with audiences, improving CTR. Industries with high-quality, engaging ads tend to outperform others.
- Competition: Highly competitive industries may experience lower CTRs due to ad saturation. Conversely, niche markets with less competition can see higher CTRs.
- Device Usage: Mobile users often have different browsing behaviors compared to desktop users, affecting CTR. Industries with mobile-optimized content may see better performance on mobile devices.
- Seasonality: Certain industries experience seasonal spikes in interest, impacting CTR. For example, retail and travel industries often see increased CTR during holidays or peak seasons.
Understanding these benchmarks allows marketers to set realistic goals, optimize campaigns, and identify areas for improvement.
Regularly comparing your CTR against industry standards can provide valuable insights into your campaign’s performance and effectiveness.
Top Factors That Affect Click Through Rate and How to Improve CTR

CTR depends on several elements that influence how users interact with your content. Here are the main factors to look at:
- Headlines or Subject Lines
- Call-to-Action (CTA)
- Relevance of Content
- Visuals and Design
- Audience Targeting
- Placement and Device
Focusing on these factors helps you not only get more clicks but also attract the right kind of traffic that actually converts.
Let’s check them in detail!
I. Headlines or Subject Lines
Your headline or subject line is the first chance to grab attention. People often decide in seconds if they want to click or move on. A strong headline is clear, specific, and easy to understand. It should give readers a reason to take action.
For example, an email titled “Weekly Update” feels dull and easy to ignore. But “3 Smart Ways to Save Time on Payroll” tells the reader what they’ll get and why they should open it.
The same applies to ads or blog titles. When your headline speaks directly to a problem or promise, clicks usually go up.
You should also test different headlines to see what works best. Try adding numbers, action words, or urgency. Even small changes like these can make a big difference in your CTR.
II. Call-to-Action (CTA)
Your CTA tells people what to do next. Without a clear CTA, they may not take action even if they are interested. A good CTA should be short, specific, and action-driven.
Instead of saying “Click Here”, you can use “Start Free Trial” or “Get Your Free Report”. These CTAs guide users and give them a reason to click.
You should also place your CTA where it’s easy to spot. Buttons, bold text, or clear links usually work best. Test different styles to find what gets the most clicks.
III. Relevance of Content
People click when your content matches what they are looking for. If your ad or email feels off-topic, they’ll skip it. Relevance builds trust and interest right away.
For example, if someone searches for “best CRM plugin for WordPress” and your ad says “Top 7 CRM Plugins Tested,” they’ll likely click because it matches their intent. But if the ad says “Affordable WordPress Hosting,” it won’t connect with them.
You should focus on using the right keywords, targeting the right audience, and making sure your content actually solves their problem. The more relevant it feels, the higher your CTR will be.
IV. Visuals and Design
The way your content looks can influence whether people click or scroll past. Clear layouts, attractive images, and noticeable buttons grab attention.
For example, a bright “Shop Now” button on a clean page stands out more than a small, hidden link. Visual cues help users know where to click and what to do next.
You should also make sure your design is consistent with your brand and easy to navigate. Well-designed visuals can make your content more appealing and increase CTR.
V. Audience Targeting
Reaching the right people is key to getting clicks. Even the best content will have a low CTR if it is shown to the wrong audience.
For example, an ad about WP ERP features will get more clicks from business owners than casual internet users. You should define your audience clearly based on interests, behavior, or demographics.
The better you target, the more likely people are to engage with your content. Accurate targeting helps increase CTR and bring the right traffic to your site.
VI. Placement and Device
Where your content or ad appears affects how many people click. Links or ads at the top of a page usually get more attention than those at the bottom.
You should also consider the device. Mobile users and desktop users interact differently. Make sure buttons are easy to tap on mobile and that content loads quickly.
Good placement and device optimization can improve CTR and help more people engage with your content.
Top Tools for Every Marketer to Track the Click Through Rate
Tracking CTR is essential to understanding how well your content, ads, or emails are performing. Several tools make it easy to measure and analyze CTR.
1. Google Search Console
Google Search Console (GSC) helps you see how your website performs in Google search results. It directly shows your CTR for each page and keyword. You can quickly find which pages attract clicks and which need improvement.
How to check CTR in GSC:
- Log in to your Google Search Console account.
- Go to Performance -> Search Results.
- You’ll see metrics like Clicks, Impressions, CTR, and Average Position.
- Sort by page or query to see which keywords or pages get the highest and lowest CTR.
- Use filters to focus on specific countries, devices, or search types.
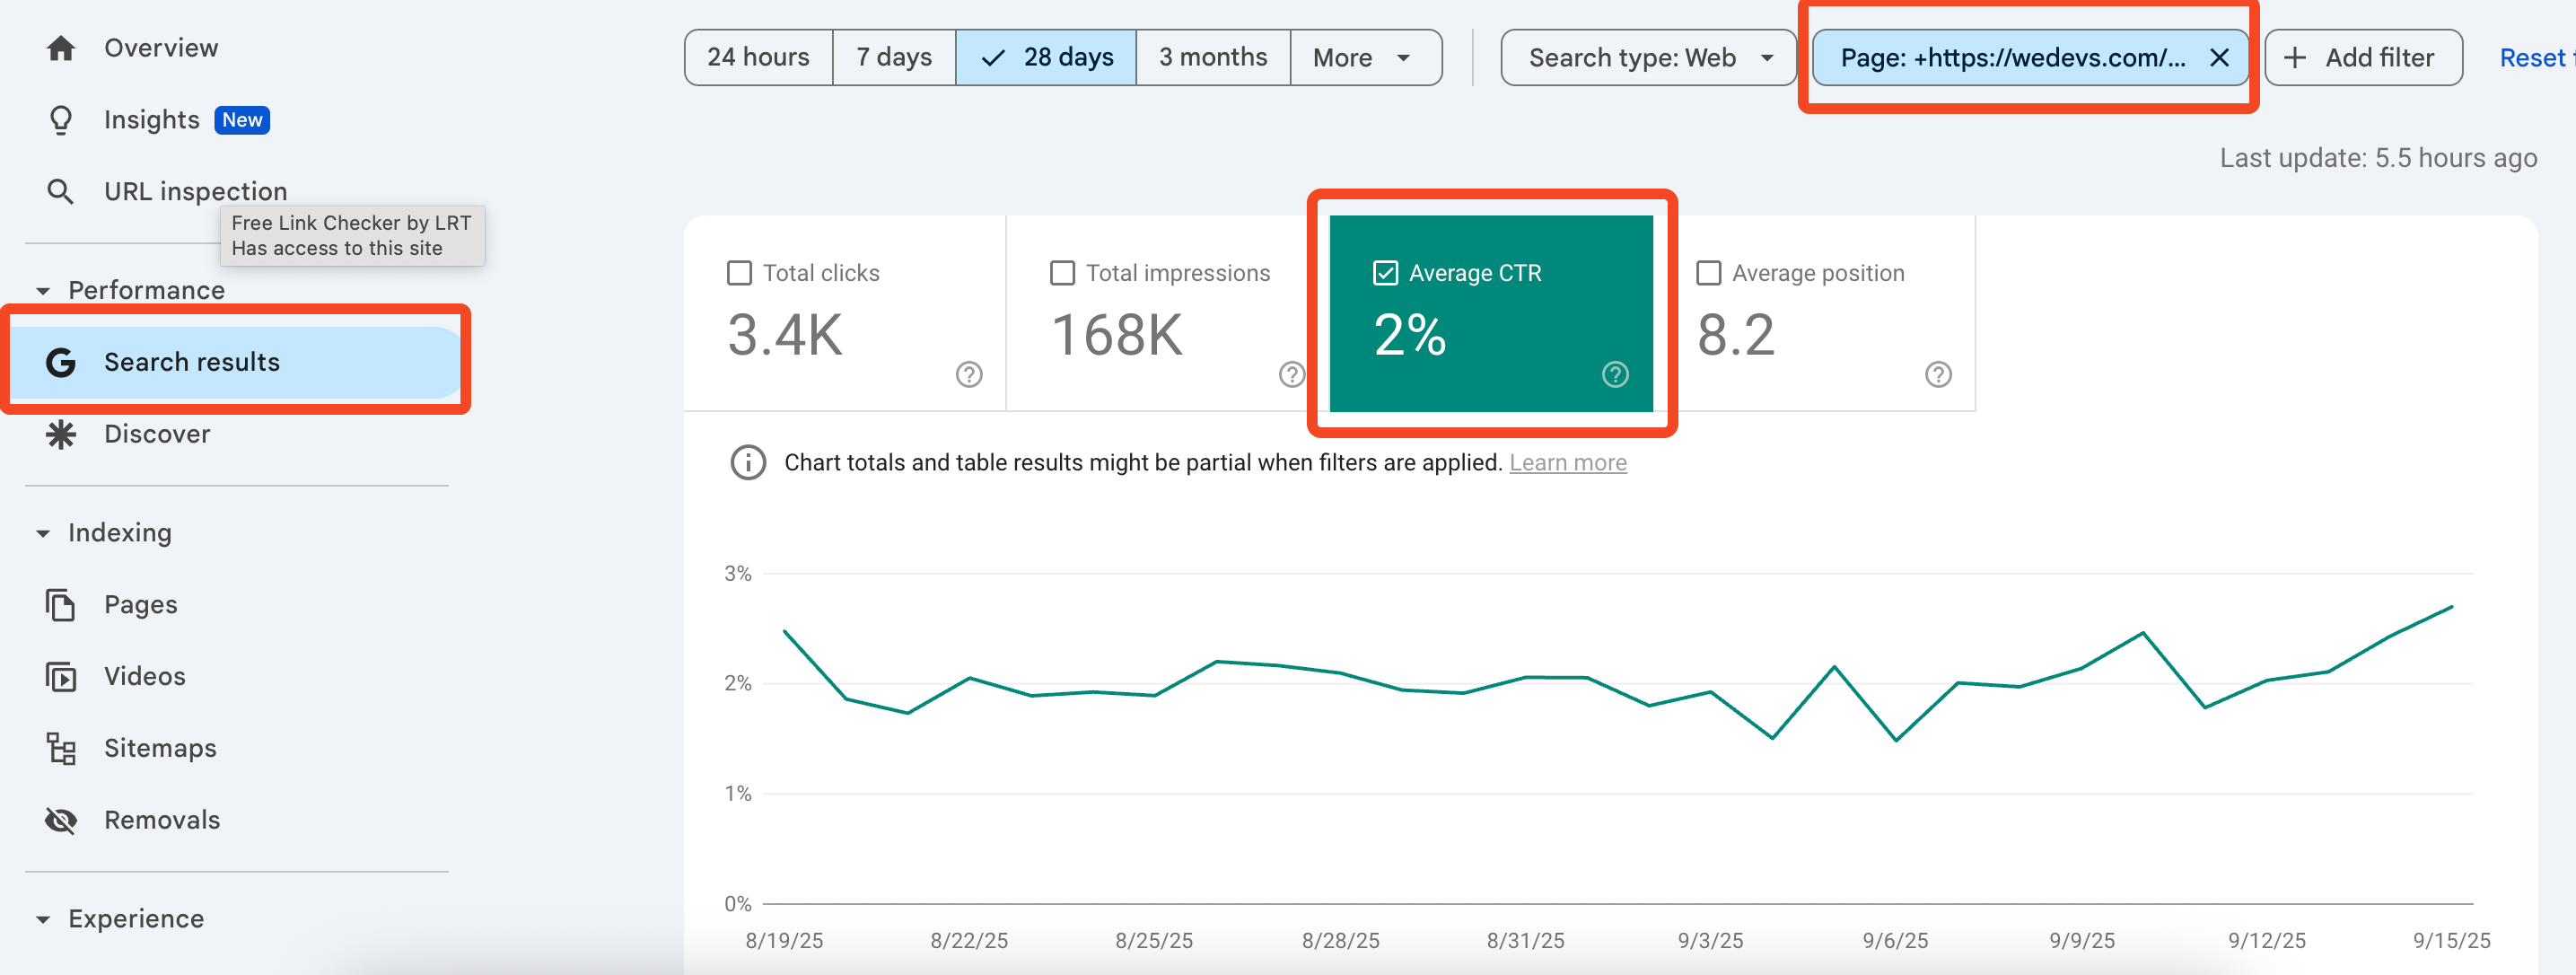
You should monitor this regularly. High CTR means your title and meta description match what users are looking for. Low CTR shows there’s room to improve your headlines or descriptions.
2. Google Ads
Google Ads shows CTR directly for your paid campaigns. You can track which ads, keywords, or placements get the most clicks. It helps you understand what’s working and what needs improvement.
How to check CTR in Google Ads:
- Log in to your Google Ads account.
- Go to Campaigns, Ad Groups, or Ads & Extensions.
- Look at the CTR column for each ad or keyword.
- Compare CTR across campaigns to identify top-performing ads.
- Use the data to optimize headlines, ad copy, or targeting.
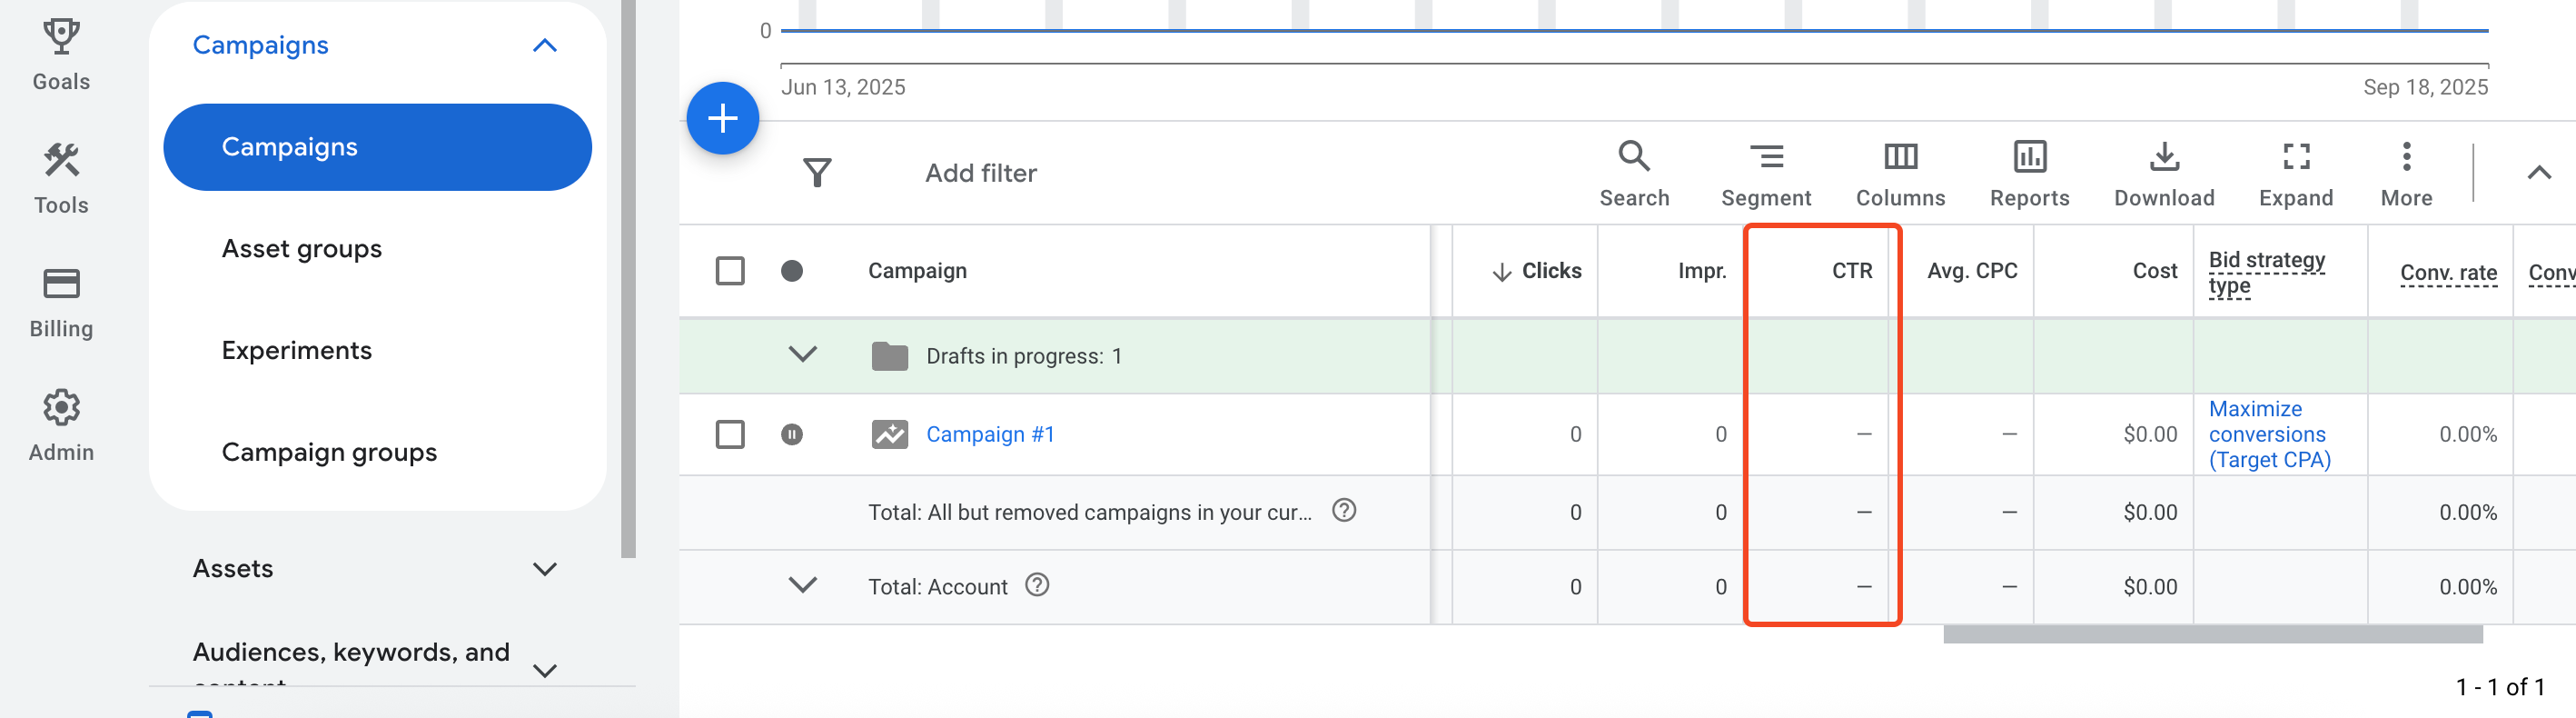
High CTR in Google Ads usually means your ad is relevant and appealing to your audience. Low CTR shows you might need better copy, targeting, or visuals.
3. Email Marketing Platforms
Email marketing platforms like Mailchimp, HubSpot, and Sendinblue directly show CTR for your email campaigns. They tell you how many recipients clicked links inside your emails, helping you measure engagement.
How to check CTR in email platforms:
- Log in to your email marketing account.
- Go to the Campaigns section.
- Open the email you want to track.
- Look for metrics like Open Rate and Click-Through Rate (CTR).
- You can also see which specific links got the most clicks.
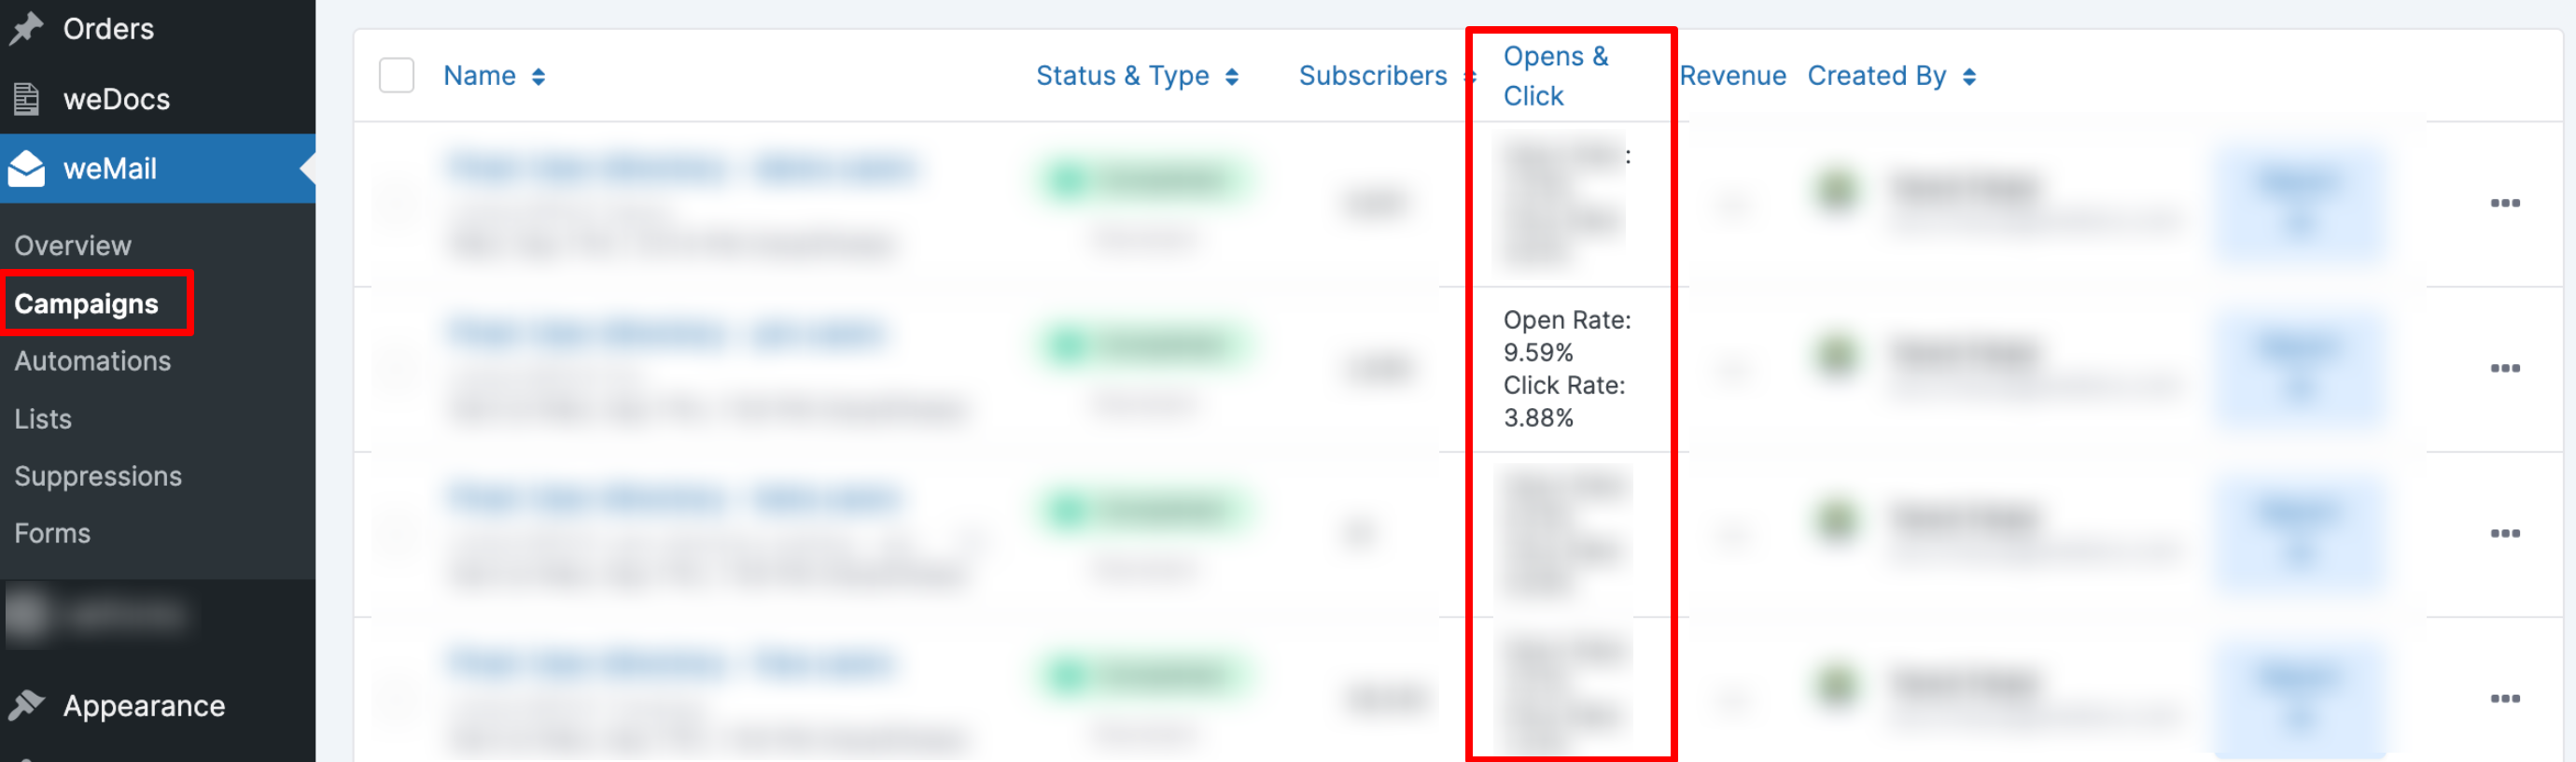
You should use this data to improve future emails. High CTR means your subject line, content, and links are engaging. Low CTR suggests you might need a better subject line, stronger CTA, or more relevant content.
How to Calculate Click Through Rate – Your Takeaways
CTR tells you how many people clicked on your link, ad, or email out of everyone who saw it. Calculating it is simple:
CTR (%) = (Clicks ÷ Impressions) × 100
Remember, a higher CTR means your content is engaging and relevant. Focus on creating strong headlines, clear calls-to-action, and content that matches your audience’s needs.
Use the right tools to track CTR accurately and keep testing different approaches. By monitoring your CTR and making small improvements, you can get more clicks, better engagement, and more results from your marketing efforts.
Now, if you have any questions, feel free to share them with us using the comment section below. We would appreciate your efforts.