

Gender Profile
The Gender Profile reports are shown in 4 separate ways:

1. A pie chart for company total male, female or unspecified with percentage markers in round numbers. It helps you to get an overall idea about the percentage of men and women comprising your employees.

2. A table with head count gender-wise and accurate percentage.

3. This is where things get interesting. Here you get a graph according to gender ratio filtered by departments.

Hovering over the bars will show you how many males and females are in that department and the total number of employees in that department.

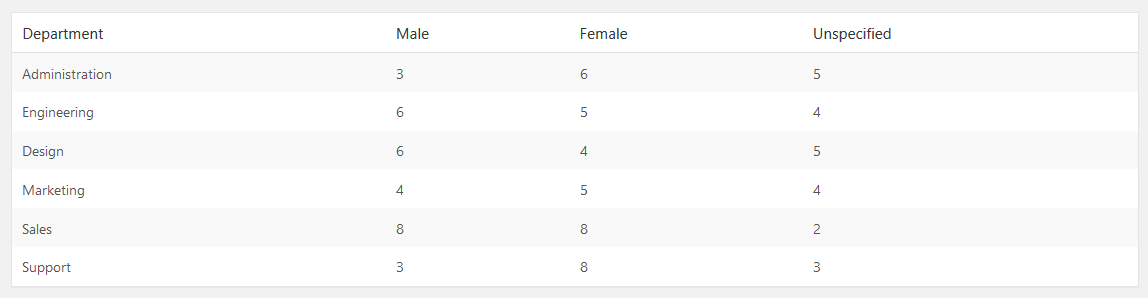
4. This table shows the exact number of different genders in all the different departments.
How is it useful?
Shows differentiation data by gender in your company.
Thus, the report gives you an accurate and detailed report of males and females in different departments in your company.
This is useful because it helps you to find our whether males and females are equally represented in individual departments and throughout the company. This data will help you to understand how diverse your company is and how further you can improve.