Head Count
Head Count Profile

This report performs 3 important functions.
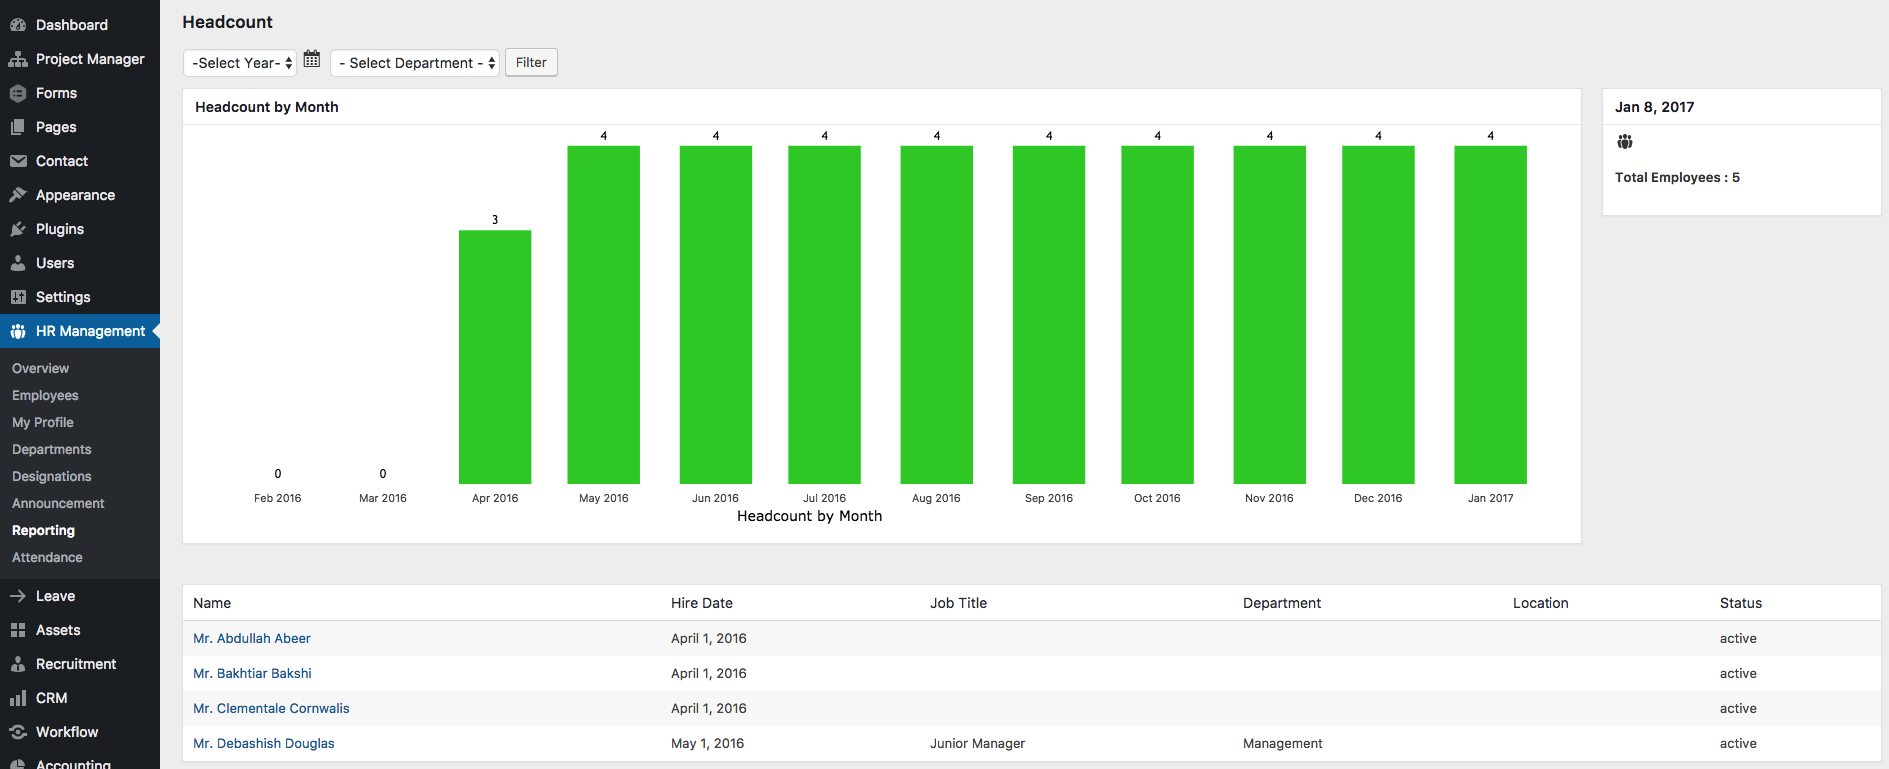
- It shows a bar chart with vertical green bars that display the total number of employees by month in your company.
So you easily get a view of the total number of employees in your company for each of the 12 months.
2. You can also filter out the total number of employees year-wise and department-wise, from the above left, as shown below.
Doing this will show you only the total employees in that department and the relevant months associated with that department.
So if a new department was created in the month of July of 2017, the employee data will only show from July and onwards.

3. Below the bar chart you also get a full categorized list of every employee, the date they were hired, their designation/job title, their department, their office location, and their employment status.
Note: This is the default view. But if you filter out the data year-wise and department-wise, then you will only see the employee list for the year and the particular department you chose to view.

You are also able to directly go to an individual employee’s profile by clicking on his/her name.
How is it useful?
This report displays actual number of individuals in your company in different departments and based on a particular year.
You can also see all employees for all years.
This is useful because as the HR admin or manager you can quickly extract this data to create your own reports and understand how your company departments are growing.


