
Age Profile Report
The Age Profile report shows how many of your employees are in each age group. It shows the total for the company and the numbers for each department.
Why use this report
- See which age groups you have the most and the least employees in, for the company or for one department.
- See if your recent hires are mostly younger or older employees.
- Plan training and hiring so that each team has a good mix of experience.
Before you start
- You must be a WordPress administrator or an HR manager.
- WP ERP calculates the age from the Date of Birth on each employee profile. If an employee has no date of birth, the report does not count that employee.
Open the report
- Go to WP ERP → HR.
- Open Reports, then click Age Profile.
Read the chart
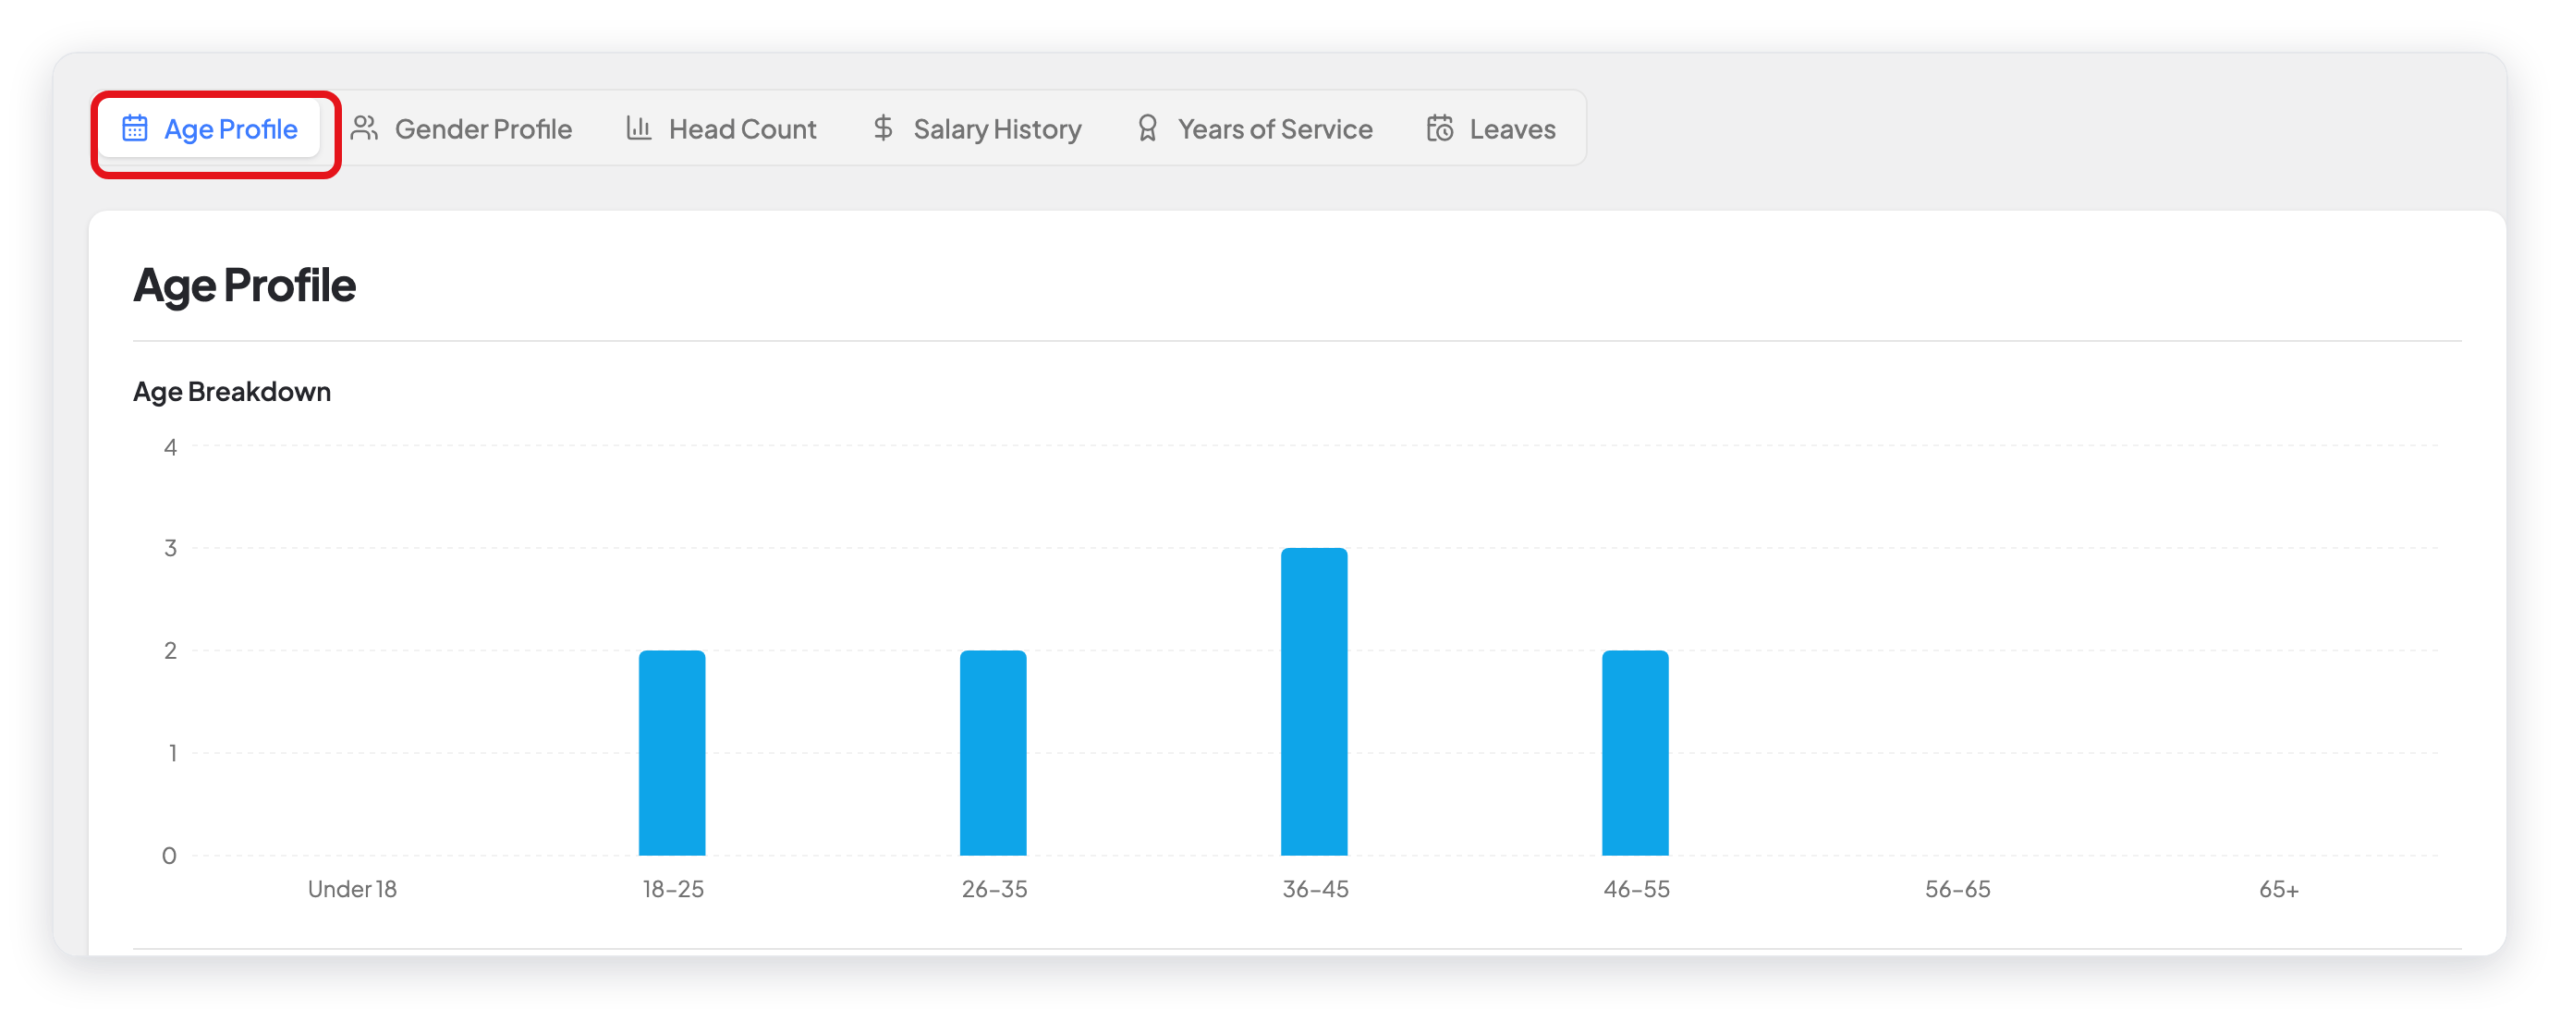
The Age Breakdown chart has one bar for each age group: Under 18, 18–25, 26–35, 36–45, 46–55, 56–65, and 65+. The height of a bar is the number of employees in that group.
Read the table
Below the chart, a table shows the same age groups for each department. Each row is a department. The Total row at the bottom gives the numbers for the full company.
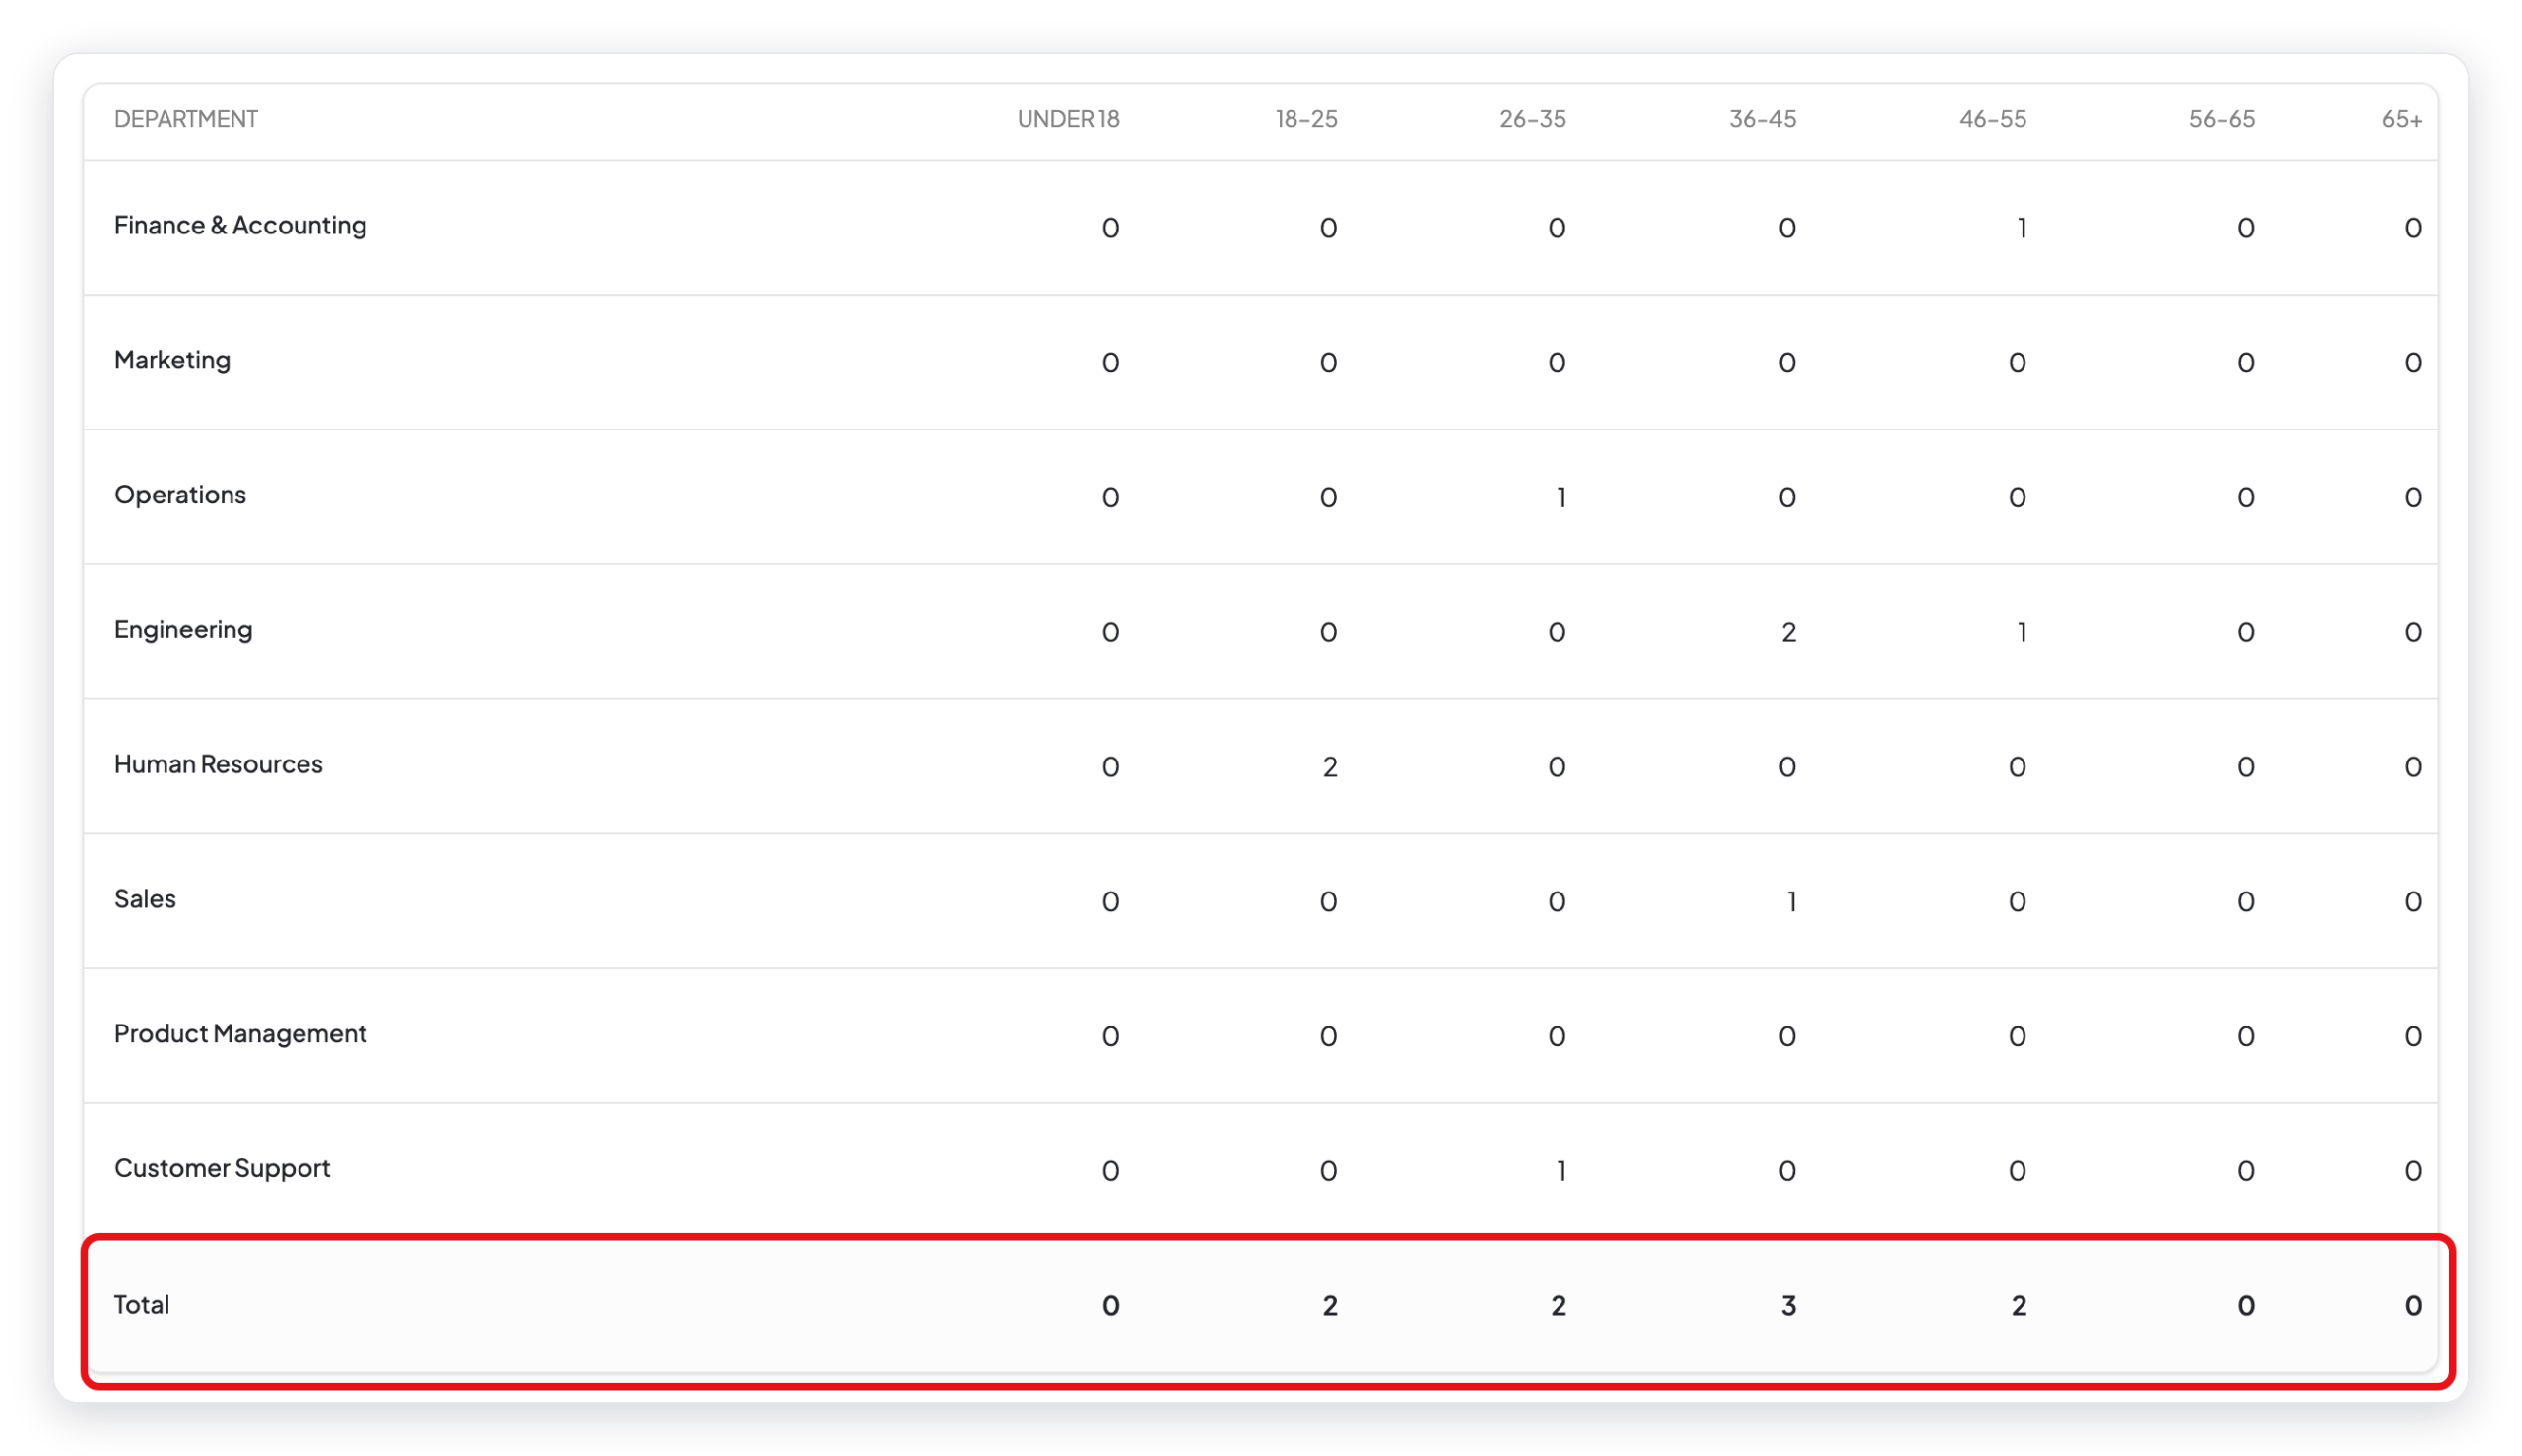
A department with no employees shows 0 in all columns.
What changed in WP ERP 2.0
- The report now has one chart for the full company. The table gives the numbers for each department.